Enernite Docs
Data table
Data table
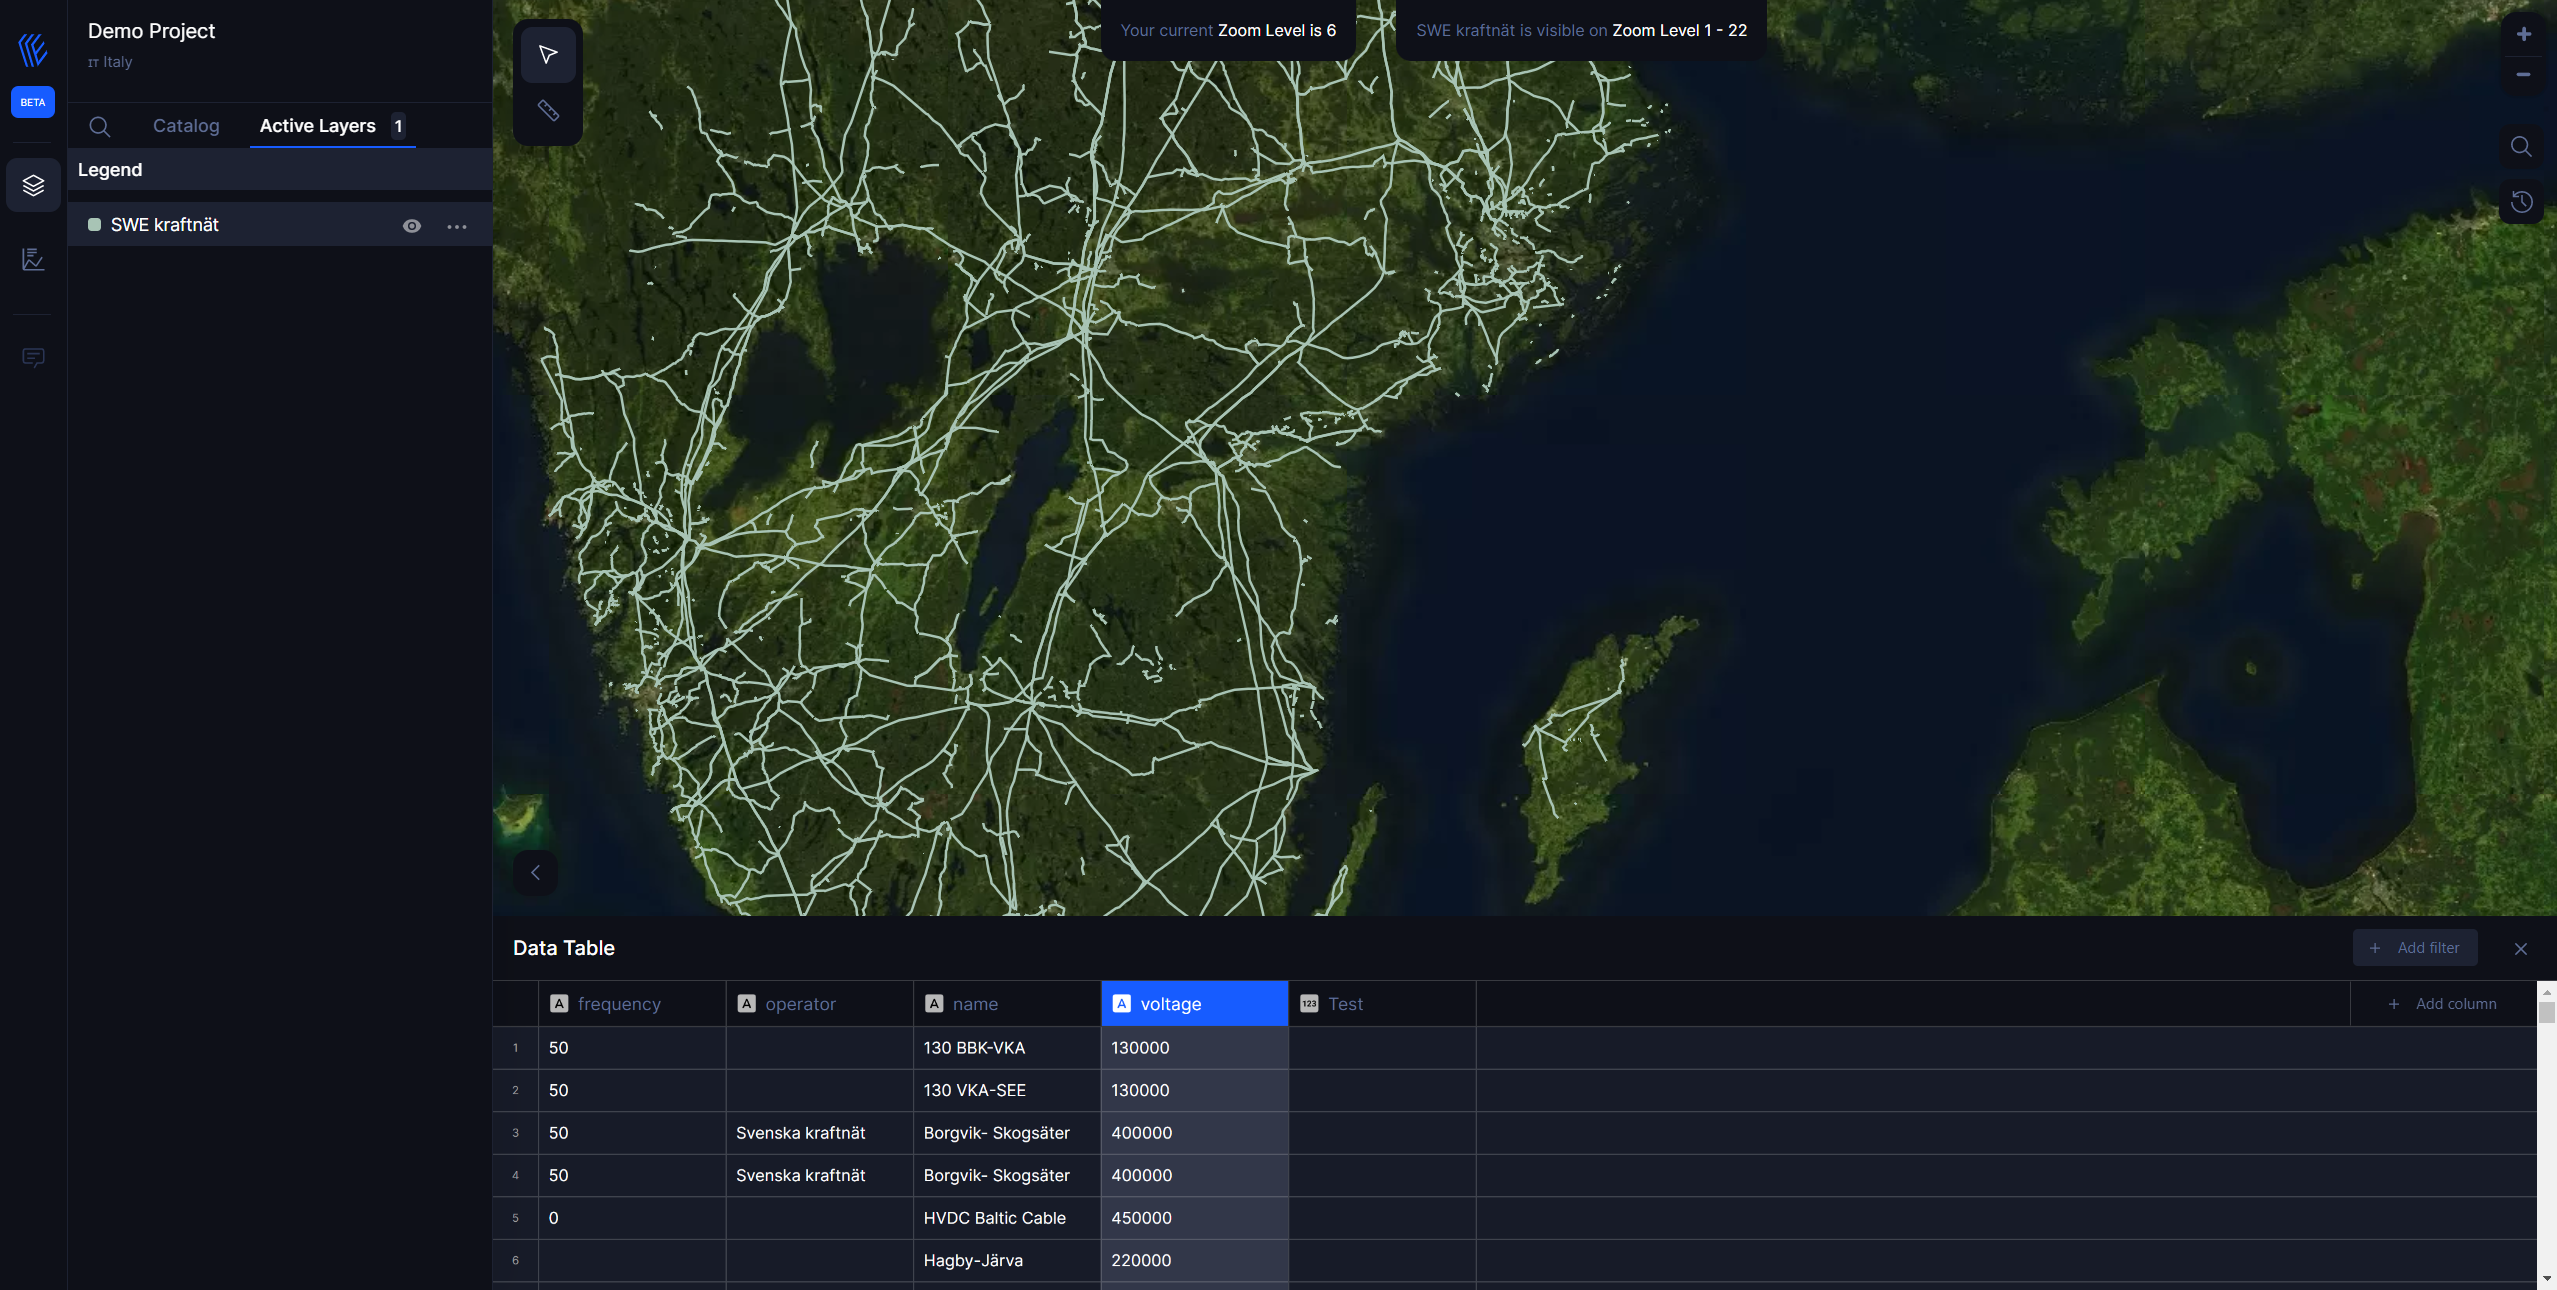
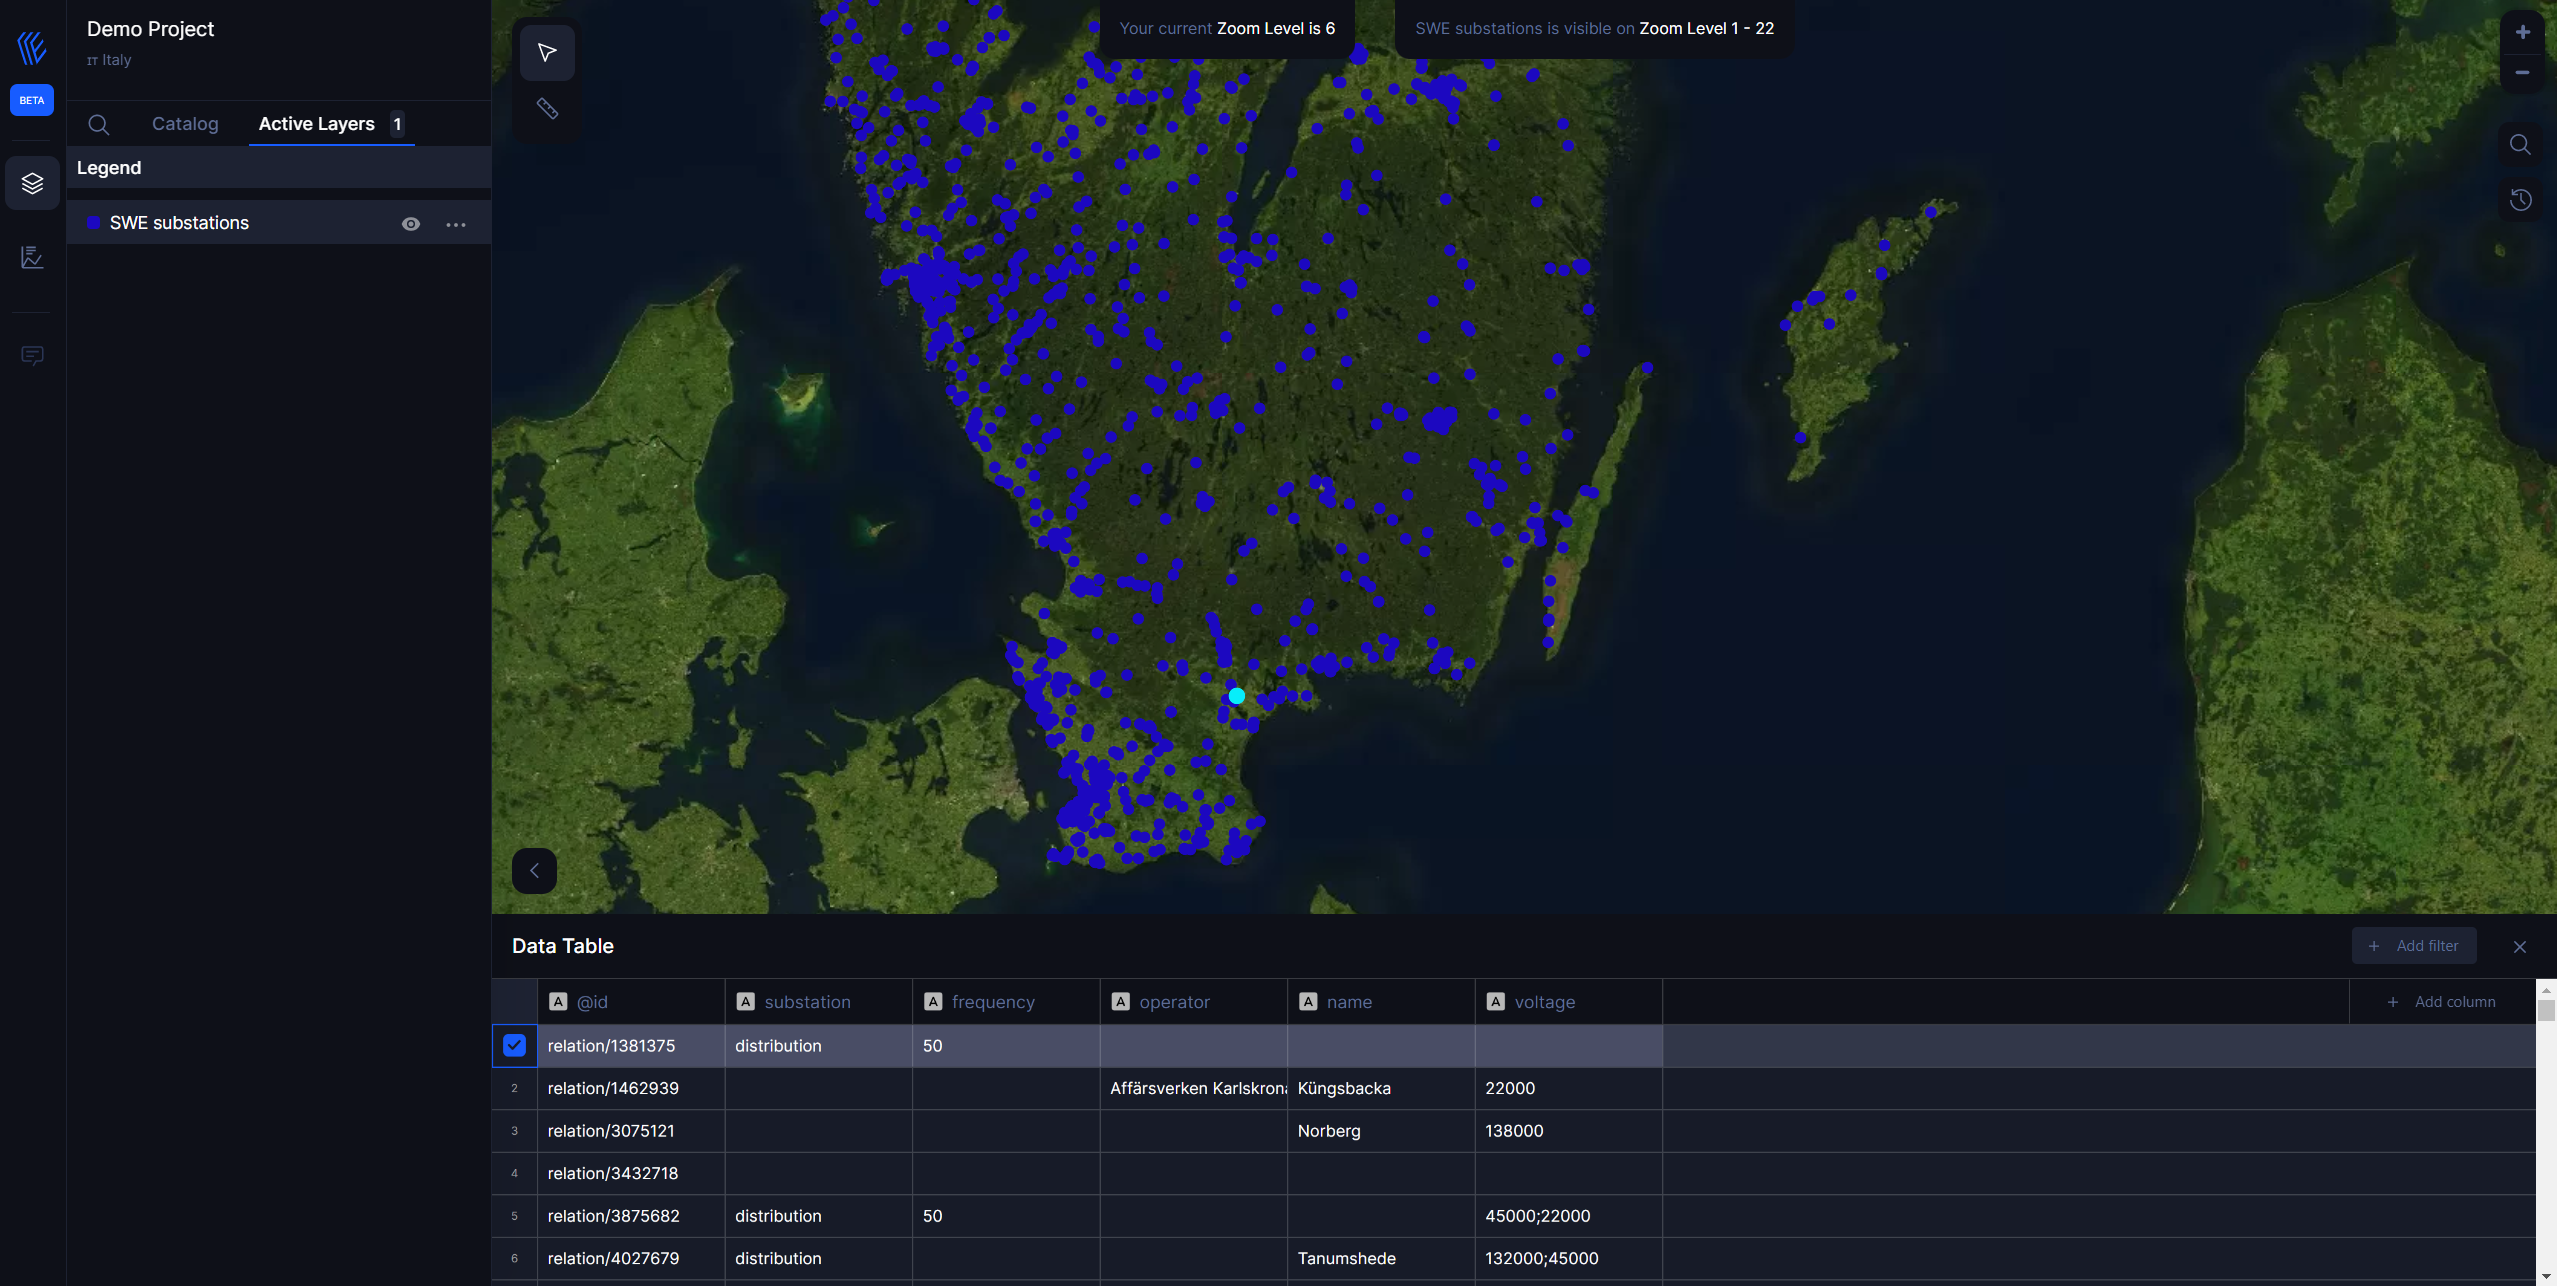
Data tables can be an important resource for your analysis. A data table displays your raw data and gives you the ability to sort, select, and make calculations using that data.
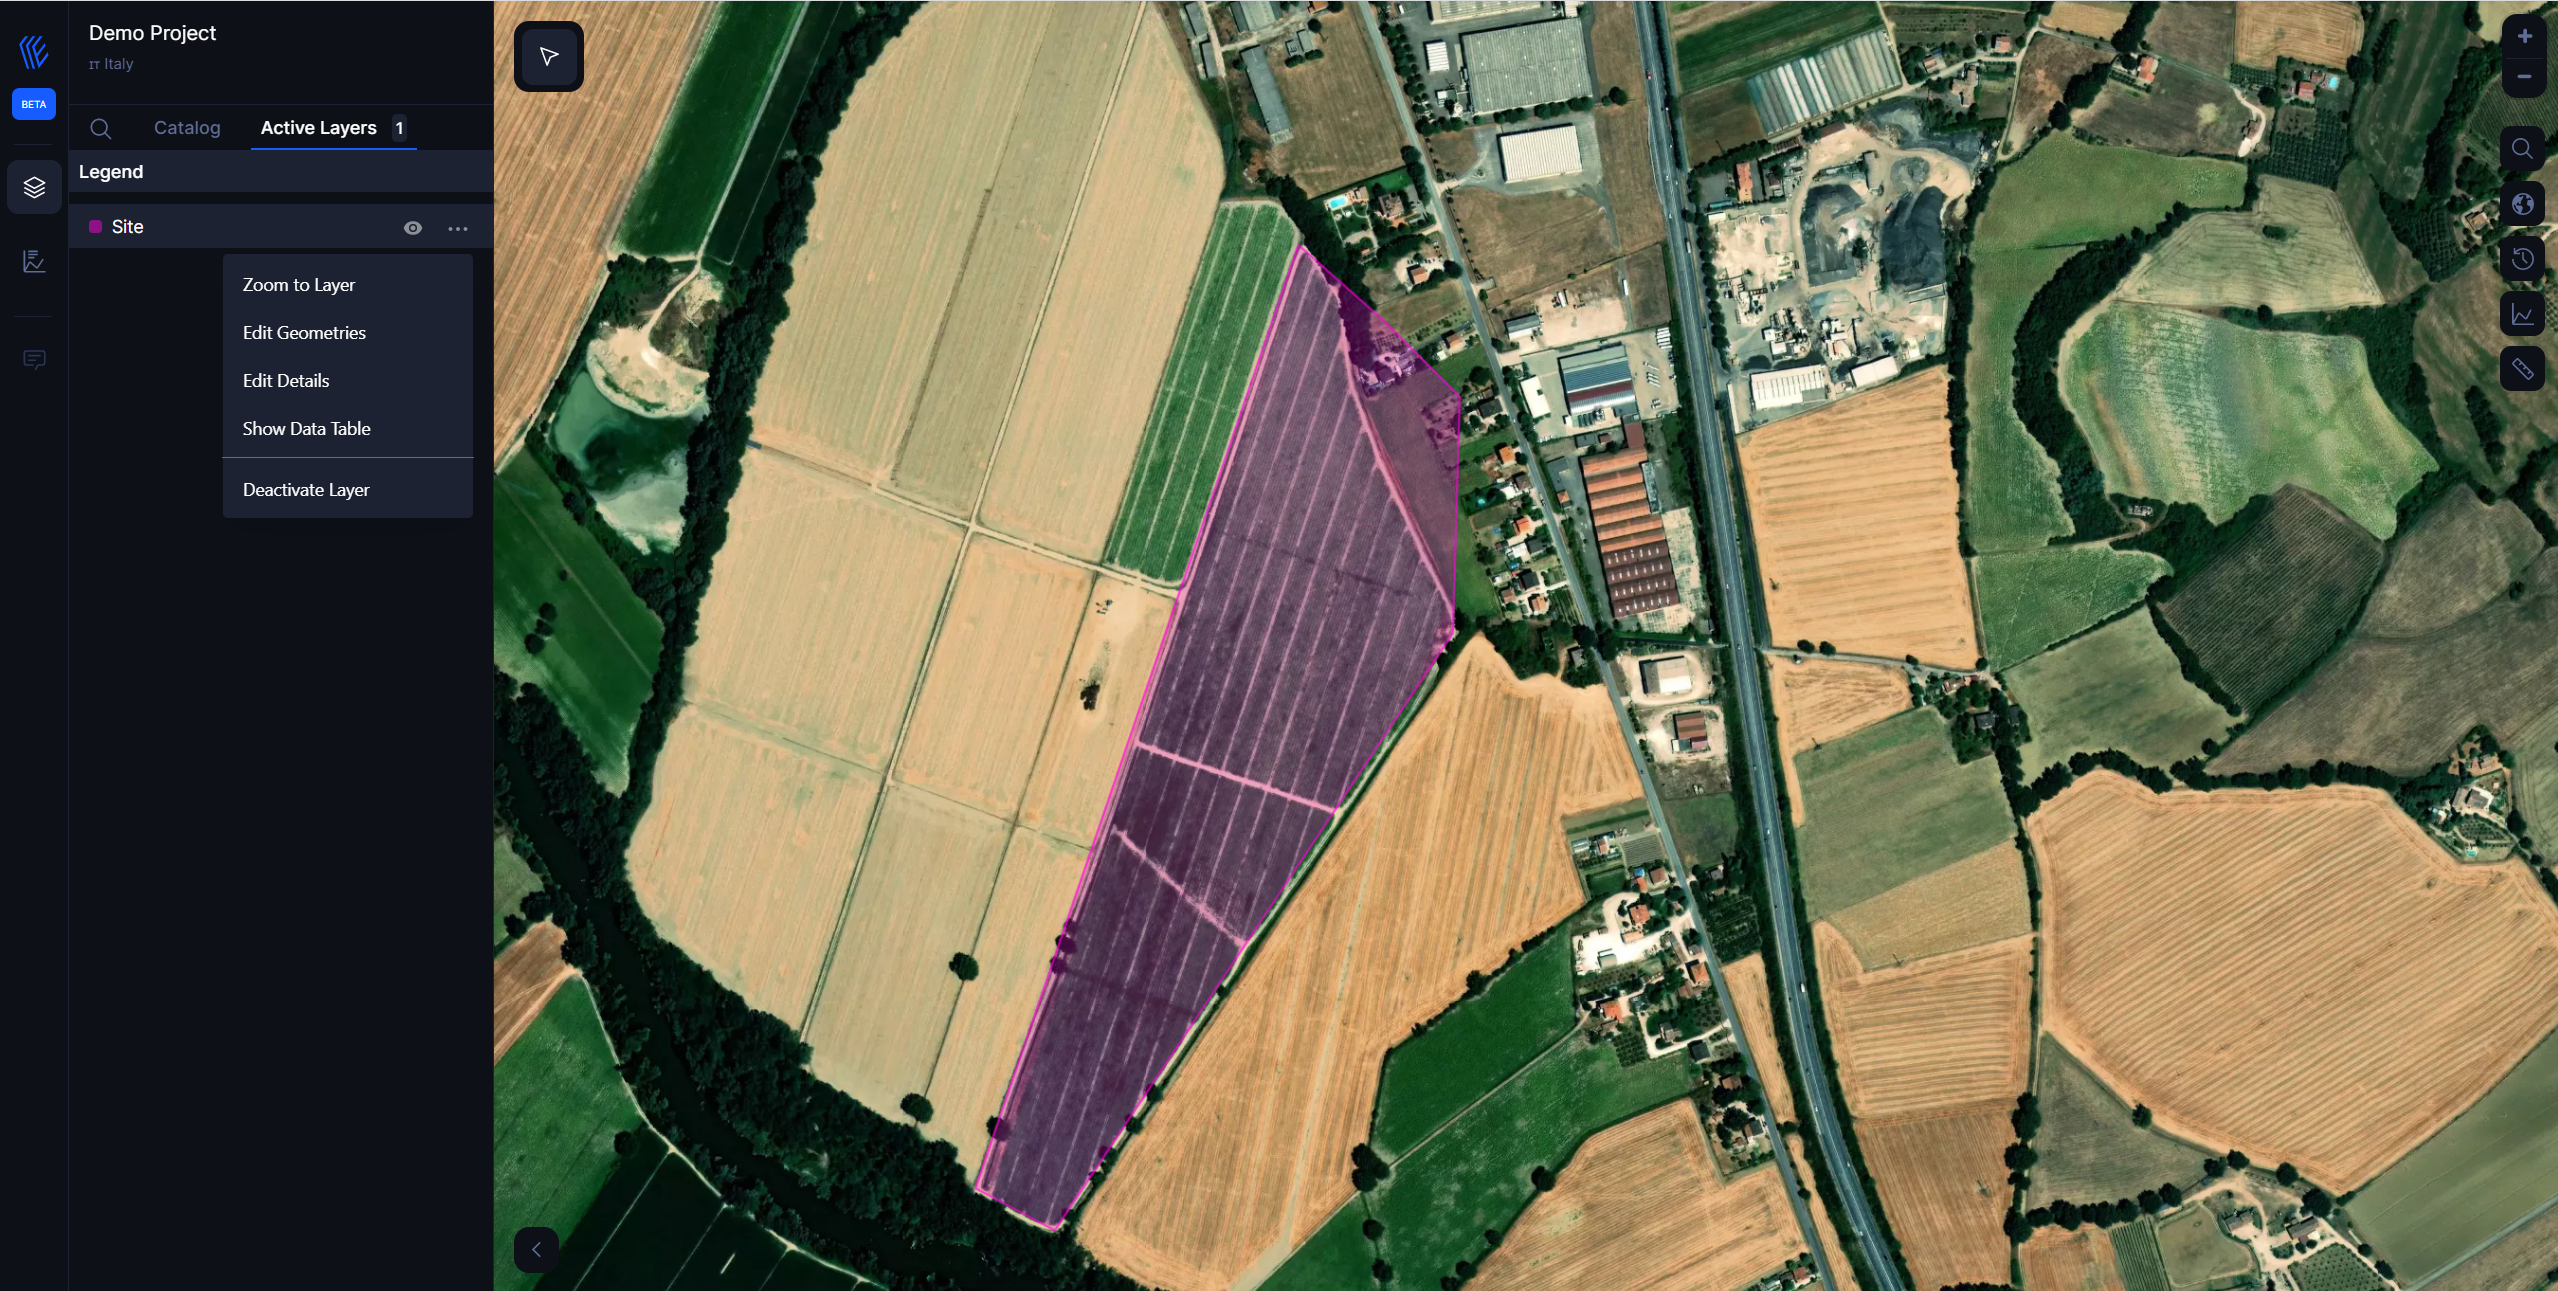
Open a data table
A data table can be opened by selecting the Ellipsis icon and then select Show Data Table in the Active Layers pane.

Edit existing fields
All fields in the data table can be renamed and resized. A field is renamed by clicking the field to highlight the text. Fields can also be renamed using the Rename field button Rename field in the data pane. Fields can be resized by dragging the field dividers.
Sort fields
You can sort a field in a data table by clicking the sort arrows next to a field name.
A data table can also be sorted by more than one field. Press Shift + click to choose more than one field to sort.

Make selections
Features in a data table can be selected by clicking a single feature or using Ctrl + click. The features will be selected in the data table as well as any maps, charts, or other tables displaying the same data.

Filter data in the table
Filtering your table provides a way to work with and focus on a subset of records. You can filter on different requirements:
- Equal
- Not equal
- Greater then
- Less then
- Between
The filtered data is shown in the map.

Add and calculate fields
Use the + Add column button to add a new field to your data table. You can click a field name to rename the field. The field will be saved unless you delete it.
[Coming soon] Once a field has been added and that field is selected, the option to calculate the field will appear. Click in the Enter calculate function box for a drop-down menu with field names and simple mathematical operations. More complex calculations can be performed using functions. Insights supports string, number, date, and logical functions, which can be accessed using the fx button.
When a calculation is complete, a green checkmark will appear and the Run button will be enabled.